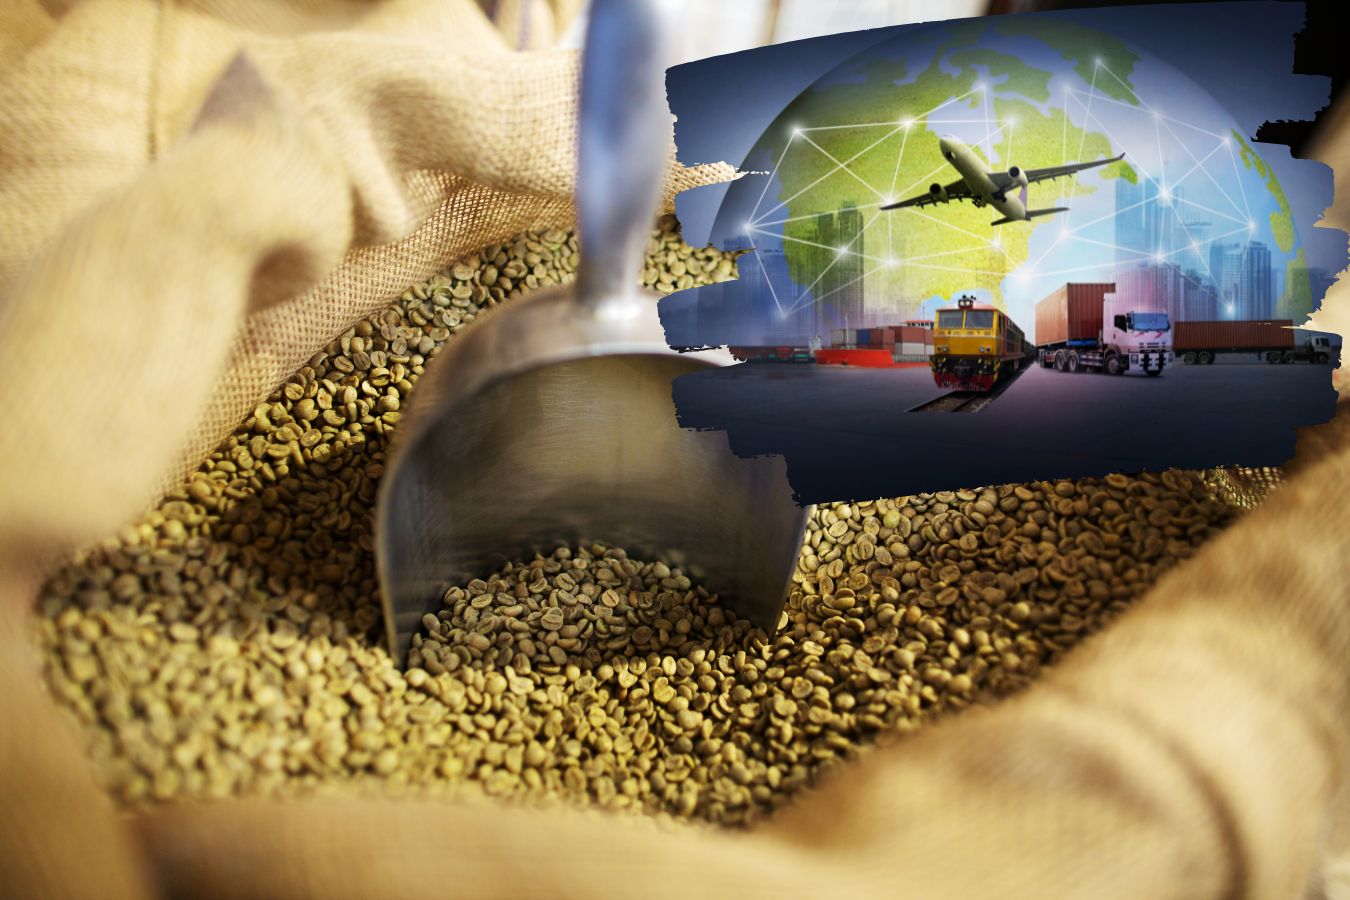
Green Coffee Bean: Everything You Need To Know Before Importing & Exporting – Although several different coffee species exist, two main coffee types are grown today.
Coffea arabica, known as Arabica coffee, accounts for 75-80% of world production. Coffea coffee, known as Robusta coffee, accounts for about 20% and differs from Arabica coffee in taste.
While Robusta beans are stronger than Arabica plants, they produce a lower-tasting beverage with higher caffeine content. Both robusta and arabica coffee plants can grow to 10 meters without pruning.
Still, producing countries will maintain the coffee plants at a reasonable height for easy harvesting.
Product Overview of Green Coffee Bean during Importing and Exporting Process
Two types of Green Coffee beans are commonly grown:
- Coffea Arabica coffee;
- Robusta Coffee – Coffea canephora.
| No. | Difference | Robusta | Arabica |
| 1. | Taste | Robusta with 2.7% caffeine (burnt tires or more rubber) | Arabica bean has 1.5% caffeine |
| 2. | Fat and sugar content | Robusta has half Arabica | Arabica contains almost 60% |
| 3. | Shape | Robusta vegetables are more than round. Robusta usually grows from 4.5 to 6 meters. | Arabica is more oval. Arabica usually grows from 2.5 to 4.5 m. |
| 4. | Chlorogenic acid (CGA) content (It’s a significant antioxidant and an insect repellent | Robusta is 7-10% CGA. | Arabica has 5.5% CGA. |
Product Overview – HS and NTL. codes
- HS code for coffee is 090111
- The NTL codes of the relevant exporting countries are as follows:
- Germany -Example: 0901110000
- Brazil – Example: 09011110
- United States – Example: 09011100
- Colombia – Example: 0901111000
- Indonesia – Example: 0901111000
- Peru- Example: 0901111000
Global Trade Overview Of Green Coffee Bean
- Total trade, major exporting countries, major importing countries
Features of the trade
- Concentration
- Average unit value
- evolution
Global Trade Overview
- Total trade, major exporting countries, major importing countries
- In 2015, global coffee exports reached US$19,800,994,000, with major importers being Brazil, Colombia, Vietnam, Indonesia and Ethiopia.
- Total global imports for the same year were US$20,474,942,000, with the US, Germany, Italy, Japan and Belgium being the main exporters.
Global Trade Overview – Import Map
Global Trade Overview – Top 10 Importers
|
The three leading importers accounted for 44.64% of the world’s total imports in 2015; thus, the product is not concentrated.
Global Trade Overview – Top 10 Exporters
| Export | The export value in 2015 (thousand USD) |
| World | 19800994 |
| Brazil | 5555374 |
| Colombia | 2526532 |
| Vietnam | 2417284 |
| Indonesia | 1189550 |
| Ethiopia | 1017109 |
| Honduras | 931667 |
| Guatemala | 663547 |
| Belgium | 602396 |
| Peru | 579586 |
| Virtue | 538421 |
| India | 535435 |
Total export value in the top ten is 16,506,901,000 USD. The proportion of the 3 main exporters is 10,499,190,000 USD, accounting for 53.02%. This means exports are not centralized.
Characteristics of Trade
World coffee imports are decreasing. Amount transferred from US$27,500.822,000 in 2011 to $20,474,944,000 in 2015
- .About 218 countries import coffee, including 177 exporters.
o No product concentration for both imports and exports
- The average export value of the world is 2893 USD.
- However, unit values vary considerably from country to country. This may be due to product quality requirements from different countries.
o The annual growth rate is 6%, and the volume is 2% (2011-2015).
o Annual growth rate is -3% (2014-2015).
Vietnam’s export performance for the selected product
- Ranked in world exports
- Major importers of Vietnamese products
- Gain or lose market share in the world market?
Export of Vietnam’s export coffee
|
The leading importers of Vietnamese coffee are shown on the table on the right;
- Tax rates for Vietnam in the world
- Market test
- Prepare a summary of your analysis and selected critical indicators based on your results.
|
Target country | Import Value in 2015 (thousands of dollars) | Unit Value (USD/unit) | World Market Share (%) | Annual growth rate In terms of value 2015 (%) | Tariff advantages | |
| A | America | 4,827,285 | 3,556 | 23.57 | -1 | 0 |
| B | Germany | 2,766,755 | 2,680 | 13.51 | -14 | 0 |
| C | Italia | 1,546,255 | 2,929 | 7.55 | 7 | 0 |
| D | Japan | 1,476,705 | 3,409 | 7.21 | 11 | 0 |
| E | Belgium | 845,355 | 3,067 | 4.12 | 7 | 0 |
| F | France | 834,370 | 2,857 | 4.07 | 21 | 0 |
Market test of Green Coffee Beans
Compare tax rates applicable to markets attractive to Vietnam and critical competitors in NTL
|
Target market | Ranking in the target market for tax rates facing Vietnam, AVE Rating (%) |
Competitive market (market share in 2015) | Tax rates of competitive markets AVE (%) |
Tariff advantage |
| America | 3rd place 6.82% Tax rate: 0% | Colombia (24.24 %) | 0 | = |
| Indonesia (6.69 %) | 0 | = | ||
| Germany | Rated 2
Vietnam’s market share in the German import market 15.64 %
Tax for Vietnam: 0 % | Brazil (35.01 %) | 0 | = |
| Colombia(7.2 %) | 0 | = | ||
|
Peru (6.28 %) |
0 | = | ||
| Italia | Rank 2 accounted for 15.44%. Tax rate: 0% | Indonesia (5.55%) | 0 | = |
| Colombia (5.22%) | 0 | = | ||
| India (10.92%) | 0 | = |
Select a target market
- Market selection: Japan
Reason:
- The fourth largest coffee importer in the world
- The export tax rate for Vietnam is 0%
- Relatively close to Vietnam in terms of geographical distance
- Being a potential trade partner of Vietnam
|
PLU |
Label | Vietnam exports to Japan | Japan imported from the world | VN exports to the world | Potential (thousand USD) | |||||||
|
Value of thousands of USD in 2015 | Annual growth 2011- 2015, %, p.a. |
The proportion of Vietnam’s export market share | Applicable Tariffs | Value of thousands of USD in 2015 | Annual growth 2011- 2015, %, p.a. | The proportion of import market share s, % |
Value of thousands of USD in 2015 | Annual growth 2011- 2015, %, p.a. | Export share % | |||
|
‘090111 | Coffee (excluding roasted and decaffeinated)) | 155750 | 3 | 6.4 | 0 | 1476705 | -7 | 7.2 | 2417284 | -4 | 12.2 | 13209 55 |
Target Market – Characteristics
D.1 Background
When available: use trade data at the country tariff level in the Trade Map
- Vietnam’s commercial activities in the target market Vietnam exported 2,417,284,000 USD in 2015
- Valuation of Vietnam using unit value
- World average coffee imports from Vietnam with a unit value of $2,174/ton
D.2 Tax rates for tariff items and target markets
Compare tax rates applicable to targeting Vietnam and significant competitors in NTL to determine tax advantages
Vietnam’s competitive market | Proportion | Tax rates of competitors | Commercial mode | Tariff advantage for Vietnam (Yes or No) | |
| 1 | Brazil | 28.05% | 0 | No | |
| 2 | Colombia | 12.76 % | 0 | No | |
| 3 | Indonesia | 6 % | 0 | No | |
| 4 | Ethiopia | 5.14 % | 0 | No | |
| 5 | Honduras | 4.7 % | 0 | No | |